Subsystem #3
Telemetry
The Telemetry Subsystem had two formats of downlink data, Powered Flight Mode and Orbital Mode. Powered Flight Mode was active at liftoff and replaced by Orbital Mode shortly before or after launch and orbit insertion. I do not know the time of the switch from Powered Flight to Orbital Mode, which was, I believe, by readout and execution of commands in the vehicle onboard command memory (delay lines) which were from the prelaunch padload message.
The downlink telemetry data was probably of PAM/FM (Pulse Amplitude Modulation/Frequency Modulation) type, and contained various channels of data, some of continuous (analog?) type and some of commutated type. Hardware telemetry units making up the telemetry subsystem (that I recall) were transmitter(s), antennas, Subcarrier Oscillators (SCOs), multiplexers, and signal conditioners, in addition to temperature, pressure, current, voltage, and position sensors, commutators, and a tape recorder. There are probably some hardware units that I have forgotten about.
One continuous channel of importance was channel 3-13, which showed total vehicle current. At least three commutated channels (3-14, 3-15 and 3-16) reported Stabilization and other subsystems’ parameters.
DATA LINES AND MALFUNCTIONS THERETO
See the RV Subsystem section of this document for information on data line problems.
TLM PROCESSING AND REPORTING
During station contacts, the main vehicle telemetry data processed and displayed at the STC was that processed by the Augmentation (referred to as Augie) Data System, extracted from the downlink telemetry carrier at tracking stations and transmitted to the STC via the 1200 (later 2400) bit per second lines. This was supplemented, particularly at anomaly time, by voice reports from the SOC (Station Operator’s Console) panel meters at the RTS’s, and by reports of Group values defined in the Orbital Requirements Document, which were extracted at the RTS and reported by voice. I also remember seeing TWX reports sent from tracking stations to the STC in Sunnyvale through a communications center.
Another capability available was for support personnel at the RTSs to play back data recorded on tapes recorded during station passes. In a postpass mode, after the realtime vehicle contact was over, station support personnel could extract selected downlink reported data from these history tapes, and report the result of their data extraction, mainly at anomaly time. More later on an important use of the telemetry history tapes recorded at each station contact in the Post Flight Reports section of this treatise.
If the station pass was a Cook pass, then a large increase in available data was possible, since the entire downlink telemetry stream from the vehicle was available in near realtime, with the stream sent from the Cook tracking station to the STC via a microwave link between the Cook tracking station and the STC in Sunnyale. This was invoked at anomaly time, and probably to a much lesser magnitude in the case of a normal (i. e., no anomaly) vehicle state.
This microwave link from the Cook tracking station to the STC in Sunnyvale allowed the FULL downlink telemetry stream to be received from VAFB in Sunnyvale in near realtime and processed through ground stations for use by analysts.
Other tracking stations were, I feel, more limited in what data they could quickly send to the STC; data available during a station contact other than Cook for the most part consisted of Augie data provided by the Augmentation Data System telemetry processing software (probably on the 1200 and later 2400 bit lines between RTS’s and the STC), voice reports, reporting groups defined in an Orbital Requirements Document, Station Operator Console (SOC) meter reports and TWX data via a message center.
This 3-13 channel (total vehicle current) reported most vehicle activity; vehicle maneuvers of any kind caused valve firing reports seen on this channel, door opening and closing were seen, pyrotechnic firings were seen, as well as payload activity including film movement, supply and takeup film reel movement, and camera mirror movements. All of these current signatures were unique in a way, and were pretty close in shape from vehicle to vehicle.
See the RV section of this document for a case where the telemetry channel 3-13 total current data was used to show that a backup pyrotechnic squib did not fire during separation of an RV from the OCV.
See below a sample of Augie Mode data printer output for a station contact using data received from the station via the 1200 bit data line, followed by an explanation of fields on that mode data display.
SAMPLE AUGIE TLM MODE DATA OUTPUT ON PRINTER
 (AT A 1 LINE/SECOND RATE)  MANNED BY VEHICLE
SUBSTSTEM ANALYSTS DURING STATION CONTACTS

	KODI-A  REV XXXX.X   MODE  ZZZ   IRON  1234
CHAN->    13  14                        15                   16
TIME	 C   6  11  18 24 25    11  12  27  28   9  10  11  13  21
-------	  --  --   --   --   --  --     --   --   --    --   --   --   --   --   --
61678	 61 32  44 07 55  44  53  54 50  54  32  44  21  92  62
61679	   58 32  45 07 58  38  52  52 52  56  34  47  24  94  59
61680	   54 32  45 07 58  43  51  52 51  55  35  46  22  95  60
61681	   66 32  45 07 58  47  53  53 50  56  33  45  19  93  61
                    	RNG  RRRR.RR   AZ -AAA.AA   EL EE.EE
61682	   61 38  45 09 55  43  54  52 52  54  32  44  18  94  62
61683	   61 32  44 07 58  46  51  51 51  56  31  46  20  92  61
							15-19 77
61684	   61 32  44 07 58  45  53  50 49  53  32  47  18  94  62
61685	   61 32  44 07 58  46  52  52 52  54  32  47  18  94  62
		 	RNG RRRR.RR   AZ AAA.AA   EL EE.EE
61686
Note the first line of the mode data display shows data is from the KODI (Kodiak, Alaska) tracking station; the -A denotes that the A side of the station was in use. Most stations had dual capability of supporting TWO vehicles at the same time; those that did were defined by side A and side B. Following the tracking station information is the REVolution the data was from, followed by the MODE active which is processing and sending the telemetry data to the STC, and the Inter Range Operation Number, which is a number unique for the mission, basically a random number assigned to each vehicle launched into space. I think one use of this number is used to track space hardware, including small pieces, such as: booster for IRON YYYY or fairing for IRON YYYY.
Note to right of CHAN are seen channels 13, 14, 15 and 16, and on the next line to the right of TIME are seen C below channel 13, defining it as a continuous (analog) channel, followed by 6 11 18 24 25 below channel 14, defining channel 14 as a commutated channel, with commutated pin numbers 6, 11, 18. 24 and 25 of what I think was a 28 pin multiplexer output for that channel. Similar data are displayed for multiplexed channels 15 and 16.
Note system time (0 to 86400 seconds) displayed for each second of data received via the 1200 bit lines from tracking stations, showing link 3 channels 13, 14, 15 and 16 data reported once each second. Channel 13 was a continuous analog channel, but for reporting at a 1 sample pee second rate via the 1200 bit per second line, the point was sampled and reported only once a second. 3-13 reported total vehicle current, discussed in other parts of this treatise . Channels 14, 15 and 16 were sub-commutated channels reporting data from 28 pin commutators. Note channel 3-15 reported values for commutator pins 11, 12, 27 and 28 which reported Stabilization subsystem values for pitch and roll IR computer output (pins 11 and 12) and pitch and roll torquer motor voltages (pins 27 and 28), which are mentioned in the Stabilization subsystem portion of this treatise.
Note range data (RNG RRRR.RR AZ AAA.AA EL EE.EE) reported once every 4 seconds, which probably became part of the tracking data reduction to include this new tracking data to update the vehicle ephemeris with the latest new data points. RRRR.RR was the range reported. AAA.AA was the azimuth reported and EE.EE was the elevation value reported for this sample.
Note the data report of 15-19 77 reported as part of time 61683 data. I believe this was a sample reported for link 3 channel 15 subcommutated point 19, and was probably acquired and transmitted with the other data reported for that second as a result of some hardware subsystem analyst in the STC in Sunnyvale saying something like “EVENT 19 ID ON” on the voice net, with the result that someone at the tracking station would respond to the voice request and cause to be added one new data value (value of 77) to be added to the other mode data sent via the 1200 bit line and reported, perhaps a one time report, or, perhaps, periodically every few seconds.
Some analyst may have assessed the value of the currently displayed values of interest from the mode data being displayed for their subsystem of responsibility and, feeling that an anomaly could be about to happen, decided to look at another point of data to see if it was reporting a good value, so they gave the voice ID ON report on the station contact net.
I think that the early Augie (Augmentation Data System) was not very robust, and the sample realtime display in this discussion would be representative of the early Augie capabilities. As an example, the data values displayed were a percent bandwidth value, ranging from 0 to 255 counts for 0 to 5 volts input, with signal conditioning hardware on the vehicle contractor hardware required before routing any value to the telemetry subsystem for output. Very little capability for performing calibration converting raw data to engineering units existed.
I do know that a few years later that Augie had capability to convert raw values to engineering units, and witnessed the calibration of data while working an anomaly during on orbit shift support on the KH9 Hexagon program.
There was a KH7 Gambit Calibration Data book that, I believe, contained engineering values for each possible value of a telemetry point i.e., likely for 0 through 255 values. This allowed subsystem support personnel to, as an example, know the value of a temperature report in engineering values (Fahrenheit), as an example. They either had a Cal Book available at the Augie printer or data sheets created from the cal book for their points of interest only, so as not to have to page through a cal book during a station contact, when response to telemetry data reviewed by subsystem analysts could be critical at anomaly time.
The calibration data used in creating the Cal book may have came from two sources. One was from vendors that provided temperature sensors for use on the vehicle who may have provided calibration data for their sensors. Data for some sensors may have been created during Gambit vehicle factory thermal vacuum testing, during what was referred to as vehicle soak procedures. During the thermal vacuum testing, a low temperature end value was set, then this temperature was maintained in the chamber until the vehicle “soaked” at that temperature for a few hours, values recorded for the soak temperature, then the temperature was set to a value such a 10 degrees higher than the previous soak temperature, and reading taken when new soak temperature was stabilized, and so on through a series of soak temperatures. This gave a series of points likely used in a polynomial fit to obtain data for any count, not just those taken at intervals during the soak test.
It should be noted that the thermal vacuum testing of the vehicle at the factory back in Valley Forge was executed to determine that the vehicle could perform under a range of temperatures; the aim was to root out a faulty component that did not work for the needed range of temperatures. It was better to find that out before launch than let it occur on orbit and impact mission objectives. Vehicle functions were formally tested during the thermal vacuum testing to surface thermal and vacuum related problems before launch. The soak test effort acquiring calibration data was a secondary benefit derived from the thermal vacuum testing.
Also, see the page below showing what I think is a picture of a Station Operator Console (SOC) panel. Note the six TELEMETRY READOUT meter panels in the upper left hand corner. This provided the tracking station with the capability of extracting values for six telemetry measurements from the downlink telemetry stream, and routing them to the SOC meter panels, where the person manning the SOC console could report the values seen on the meters. Readers may note display of other parameters on the SOC console that are of interest and importance.
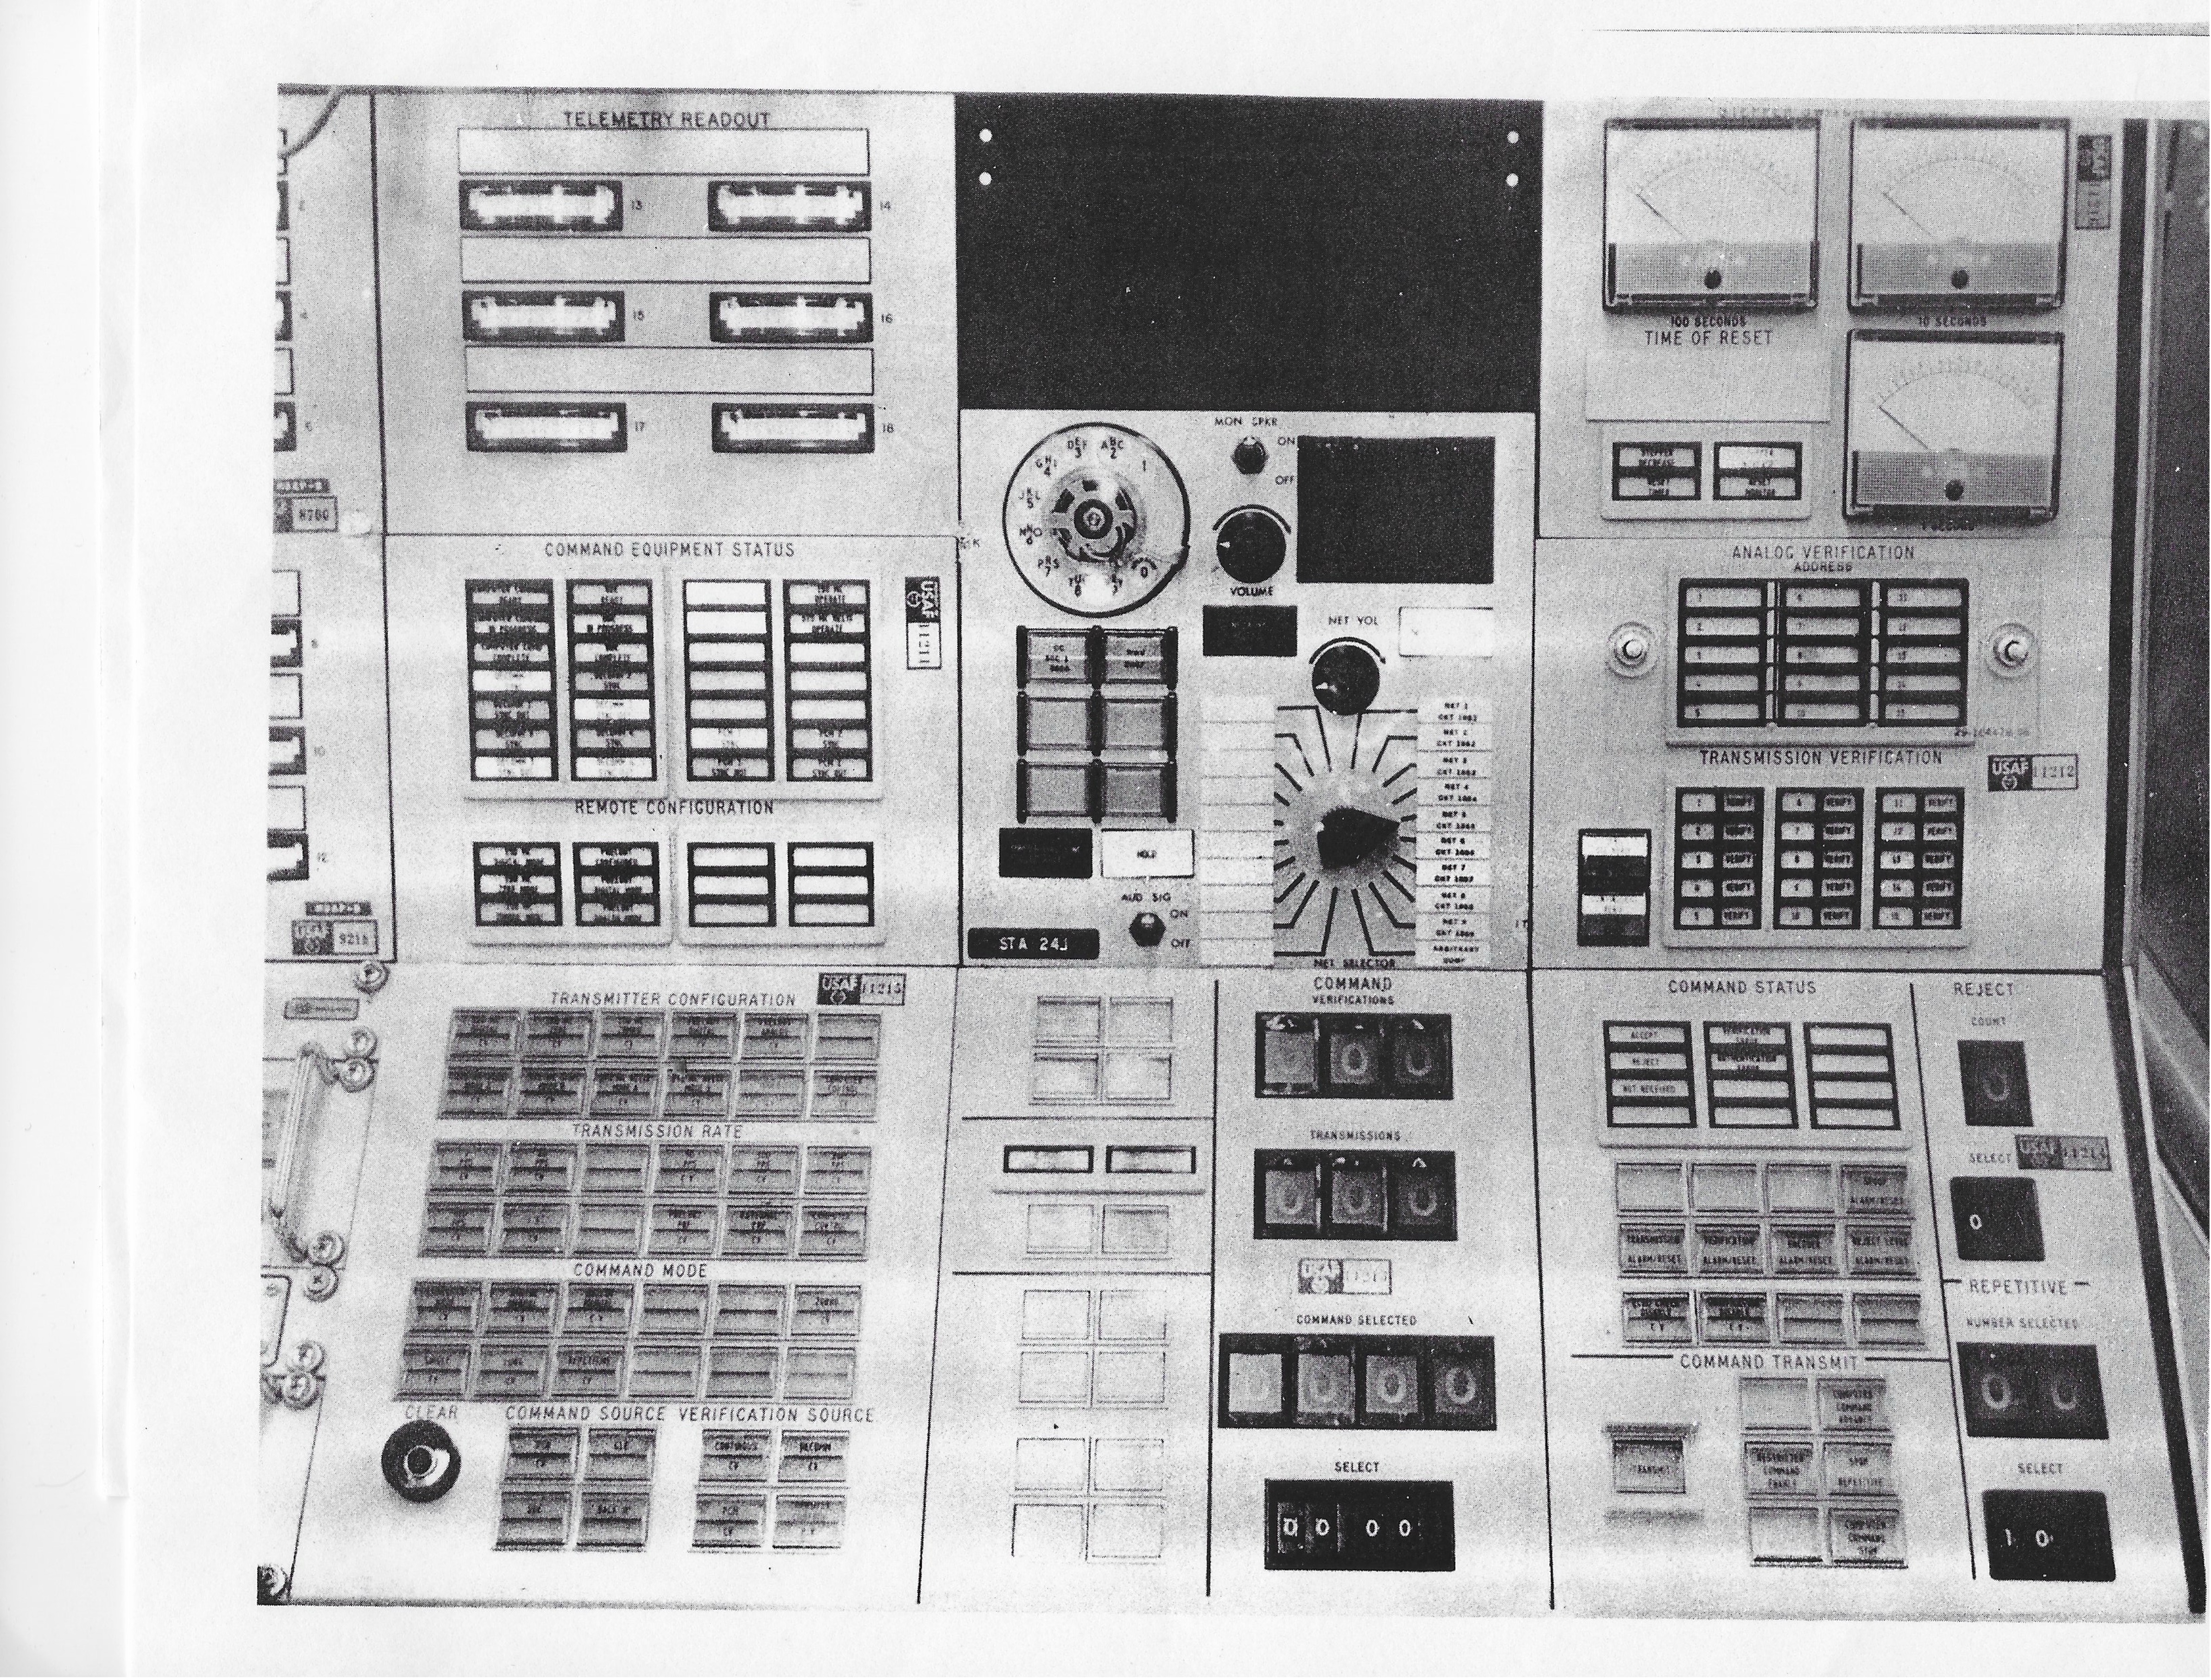
SOC Operator Console panel
RTS’S FULFILLING UNIQUE NEEDS
The Cook tracking station was unique, in a way, having a microwave link to the STC in Sunnyvale, a capability that, as far as I recall, no other RTS could provide. This was a valuable asset at anomaly time, when the FULL telemetry downlink was available at the STC for anomaly investigative use, a far cry from the data from other stations via the 1200 bit per second line.
The Pogo (located at Thule, Greenland) tracking station was, I feel, a bit more important, from a geographical location standpoint. Its location was nearer than other tracking stations were from a key denied area where mission imaging operations were conducted. The G satellite would pass in view of the Pogo station, proceeding over the North Pole area, then continue south over a denied area where imaging operations were conducted. In general, the satellite was visible to the Pogo station tracking antenna as the time of day approached when it was nearing the time to start conducting imaging operations (it was daytime over denied area) shortly after going past the Pogo tracking station. I think that the Pogo tracking station was in view of the vehicle on several consecutive orbits of the satellite, probably to the east of the tracking station on a pass, then nearer the station on the next revolution as the earths’ rotation caused the ground trace of the vehicle to be at or near the station, and, on the next revolution, the ground trace of the vehicle was to the west of the tracking station.
The Hula and Kodi and Pogo tracking stations were the stations during which the RV deboost activities took place; thus their geographical position was important to the RV deboost activities.
MISSION PROFILE GENERATION AFTER ORBIT PICKED
	MANUAL GEN – LOAD STAs & SPANs PICKED
	RUN DECKS WITH SPANS SET DURING REHS
		BAD INJECTION RUINED PROFILE/DECKS
	LOAD DECK – SAMPLE
	MISSION PROFILE – SAMPLE

COMMUNICATIONS
	BACK LINE, TROPO SCATTER
In discussing communications links that supported operations, two that I recall being active in receiving or sending information in a backup mode when the normal network links were down or otherwise not available that I do not know much about were referred to by Test Controllers as a “backline” and a “tropospheric scatter” capability.
The backline reference seemed kind of casual and I wonder if perhaps it involved merely picking up a phone and dialing a tracking station to discuss something that did not need to be discussed over the normal SCF network with potential for lots of people listening.
The tropospheric scatter communication involved bouncing signals off the troposphere to a receiving site which was not visible from the transmitting site. This was utilized when the nornally used link was not available or down due to some comm problem.
     TAPES – COURIER HAND CARRY
	ARMED SURVEILLANCE
	ALSO USED PO BOX FOR ALL DOCS
		USING REGISTERED MAIL
		PO BREAKIN
		PO BOX LOCATION CHANGED

GENERAL ANOMALIES

	CONTACT PROBLEM MEANT LEFT
		STATION WITH DOWNLINK ON
		OVER BAD AREAS
	9.28 VS 4.47 PADLOAD TIME ERROR
	DOOR BLOWN OPEN BAD THERMAL STATE
	COMPUTER PREARM

PREPASS BRIEFING
	GROUPS ATTENDING
	SUBJECTS
	PASS PLAN APPROVAL
	PASS PLAN CONTENTS AND SAMPLE
	STATION BRIEF BEFORE VEHICLE ACQ

SUPPORTING GROUPS
201 EFFECT
1962-1965 PRELAUNCH EFFORT INCLUDING REHS
1965-1967 PRELAUNCH EFFORT INCLUDING REHS
NETWORK
REHEARSALS
	REHEARSAL CONDUCTION
	ANOMALIES TO TEST SYSTEM AND PROCS
Go to Subsystem 04: Tracking.